Validation case
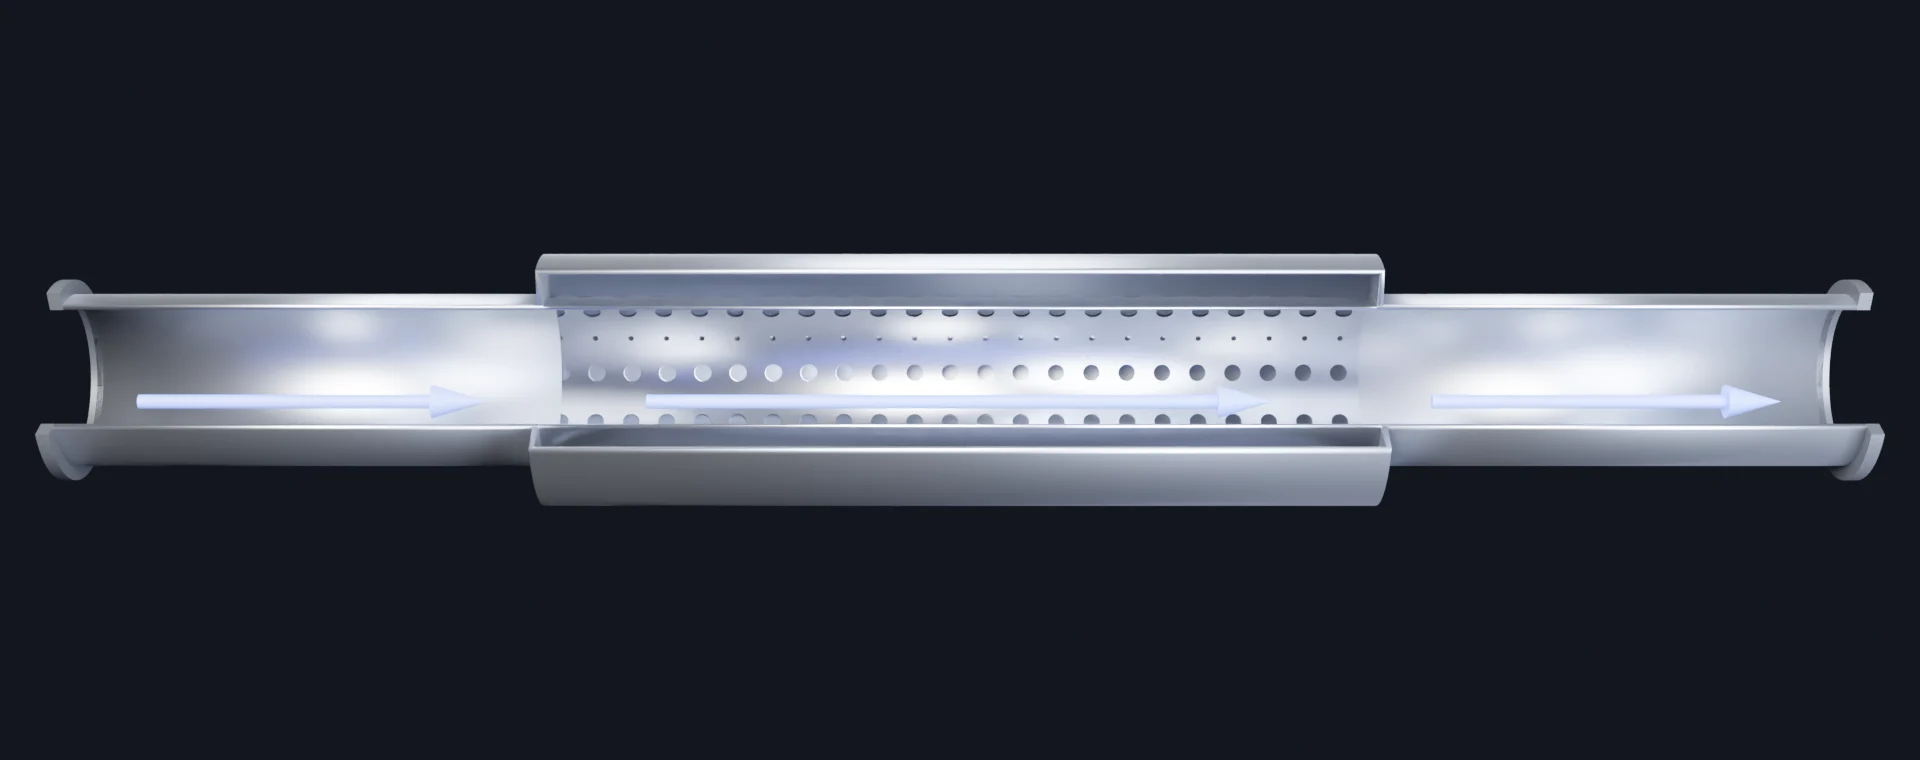
Concentric-tube resonators
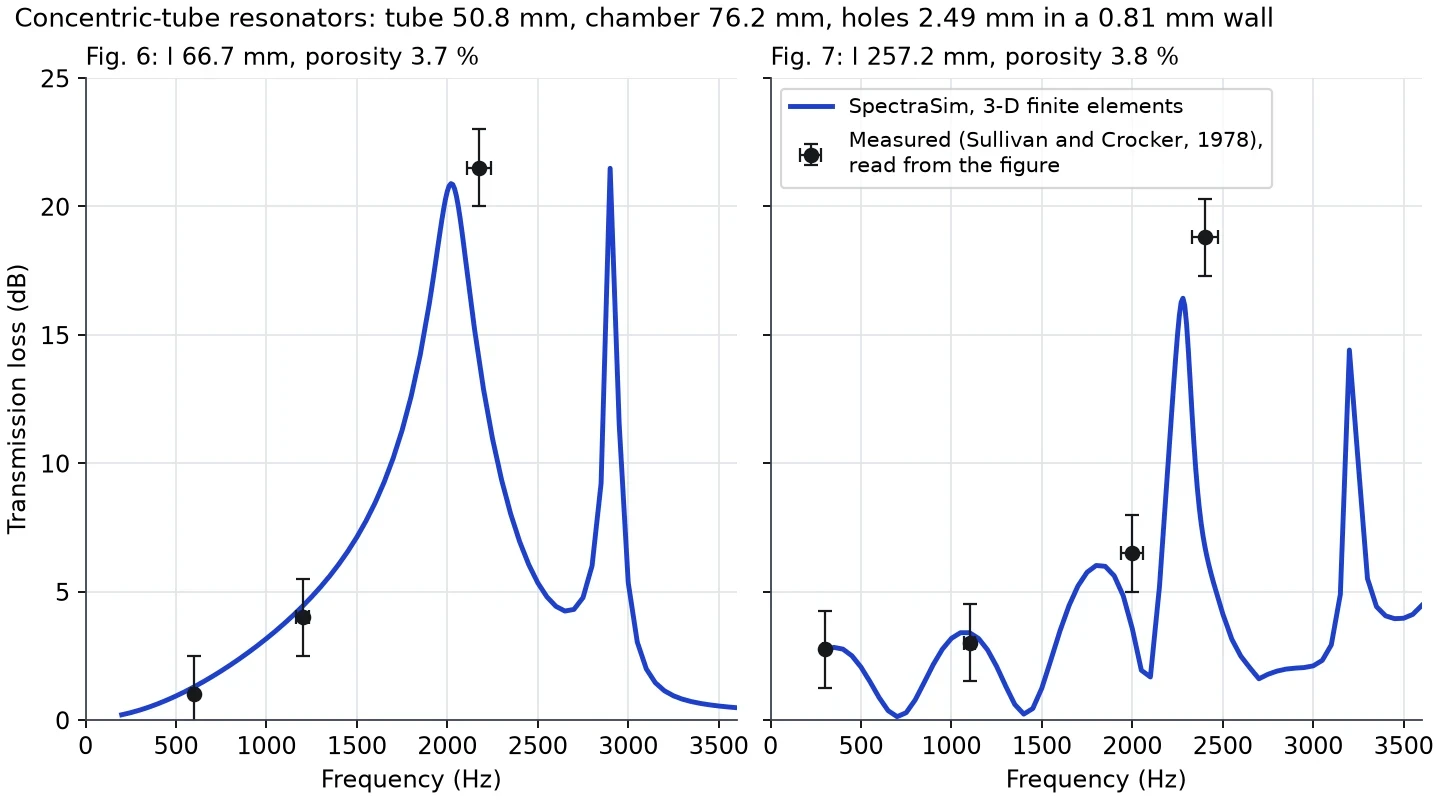
Against measured transmission loss, for the concentric-tube resonators (Sullivan and Crocker, 1978), SpectraSim gives: main peak 7–10 % lower in frequency than measured, peak levels within about 2 dB; humps within 1 dB.
≈ 2 dB peak levels against measured
Results
How close is SpectraSim?
Main peak 7–10 % lower in frequency than measured, peak levels within about 2 dB; humps within 1 dB.
Model and set-up
- Reference
- Measured transmission loss
- Perforated tube, inner diameter 50.8 mm, in a chamber of 76.2 mm; holes 2.49 mm in a 0.81 mm wall.
- Two lengths: 66.7 mm with 3.7 % open area (the paper’s Fig. 6) and 257.2 mm with 3.8 % (Fig. 7).
- Perforate impedance: Sullivan and Crocker’s own fit to their measured perforate; air at 20 °C, no mean flow, anechoic ends.
How to read the result
- The measured values are read from the paper’s figures (about ±3 % in frequency and ±1.5 dB), so the comparison is generous and says so.
- The 3-D finite-element resonance sits below the measured one and is converged in the mesh. At this size (k r = 0.9 at the resonance) the field is no longer plane, which a 1-D model cannot show.
- Main peaks in the plotted run: 20.9 dB at 2020 Hz against about 21.5 dB at 2175 Hz measured (Fig. 6), and 16.4 dB at 2280 Hz against about 18.8 dB at 2400 Hz (Fig. 7).
- The low-frequency humps are within 1 dB of the measurement.
Selected cases
Other validation cases
-
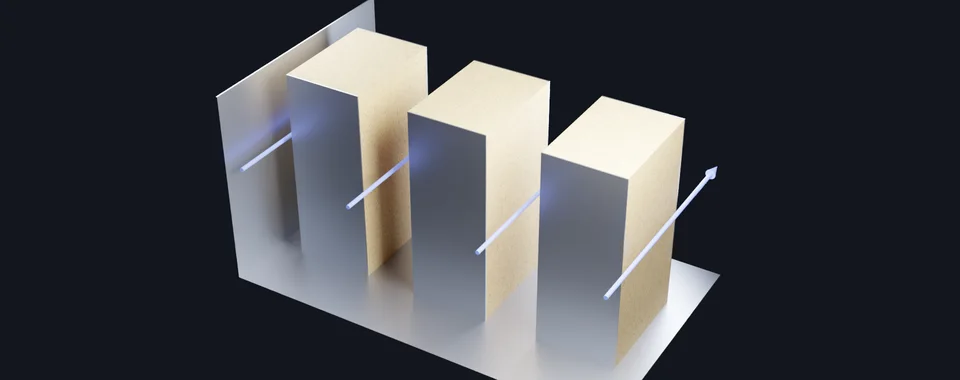 Measured Parallel-baffle (splitter) silencer 1.37 dB TL rms difference, 50 Hz to 4 kHz
-
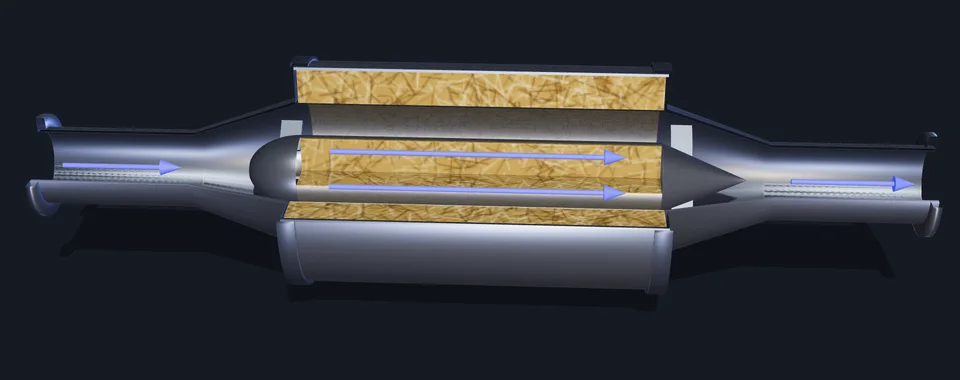 Analytical Pod silencer with absorbing pod and lining 1.3 dB TL rms difference below the 1.7 kHz cut-on
-
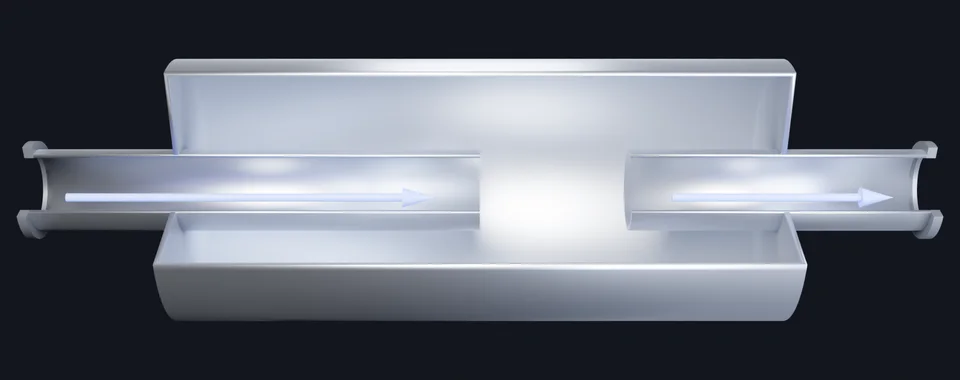 Code-to-code Muffler with an extended-tube chamber 0.12 dB TL rms difference, 20 Hz to 1 kHz
-
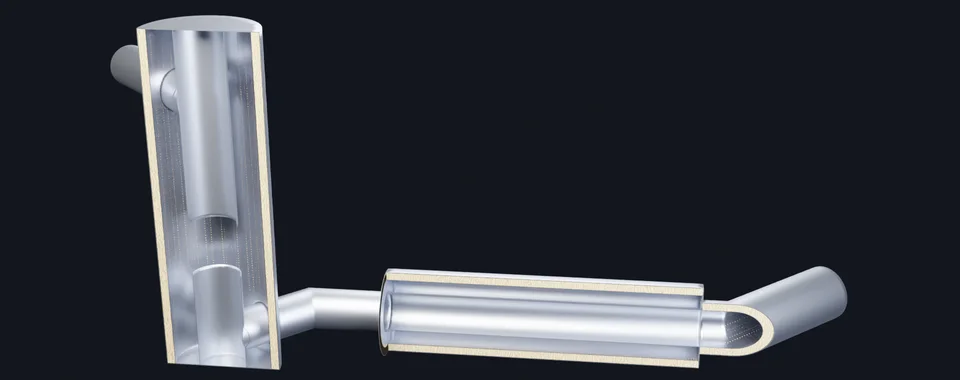 Code-to-code Exhaust muffler with three absorbing packings 0.16 dB TL rms difference, 20 to 500 Hz
-
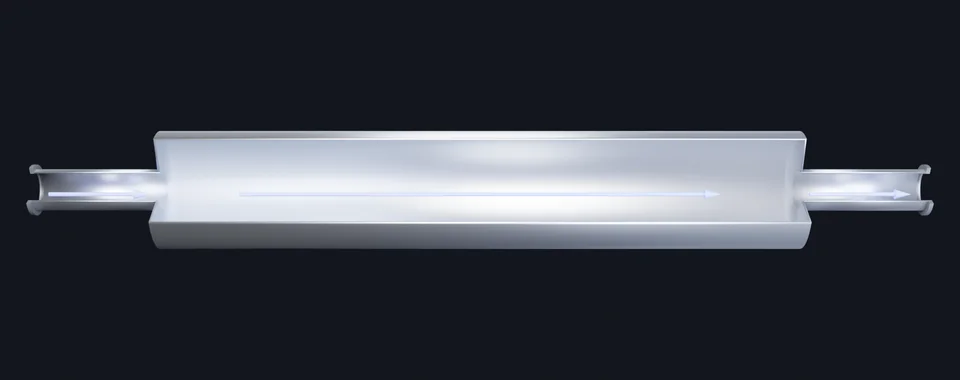 Analytical Expansion chamber against the exact 1-D solution 0.36 dB below 0.4 of the first cross-mode cut-on
Check it on your own muffler.
Download SpectraSim and run your geometry, or let our engineers run the study and compare it with your test.